OLD...Running the POL DAQ system
How to run the POL data acquisition system
Running the POL DAQ system.
Starting from scratch:
Note: if not using machine isdaq01's console, follow the instructions below with the following important differences :
- In a terminal window, sign onto isdaq01 as pol by typing: ssh pol@isdaq01
- Once logged on to isdaq01, in this terminal window, open a netscape session on isdaq01 by typing:
- netscape &
Use this netscape rather than clicking on the Navigator wheel as described below (the link to POL DAQ status will not be found on the local machine's Netscape).
In DESKTOP 1
- Windows should appear labelled PPC (POL experiment).
The PPC window is useful for looking at the information about the scanning
variable values.
- Note: if the window labelled PPC (POL experiment) appears then quickly disappears, the terminal server might be frozen. This is the the box called 'Performance 4000' in the POL blue rack. Just unplug it and replug. Once the initialization is complete, retry the start-all procedure.
- If this still does not work, in a second terminal window type telnet vwisac2 and this will connect you to the PowerPC in the VME DAQ crate via telnet.
The PPC window is just an interface to the PPC. If
it comes to be inactive during a run, the acquisition is still going along.
It is only a watch point for anyone to follow the process.
There will be a lot of output. When the PPC is ready, you see the message:End of routine frontend_init. PPC is READYThis command can also be performed on the front end of the PPC by pressing the 'ABT' bouton.
- Select NaCell or Laser or CAMP by clicking twice on appropriate button
- Select PPG label below the buttons to setup the parameters (i.e. label ppg1n or ppc1d or ppg1c)

- Press Status when all parameters are set
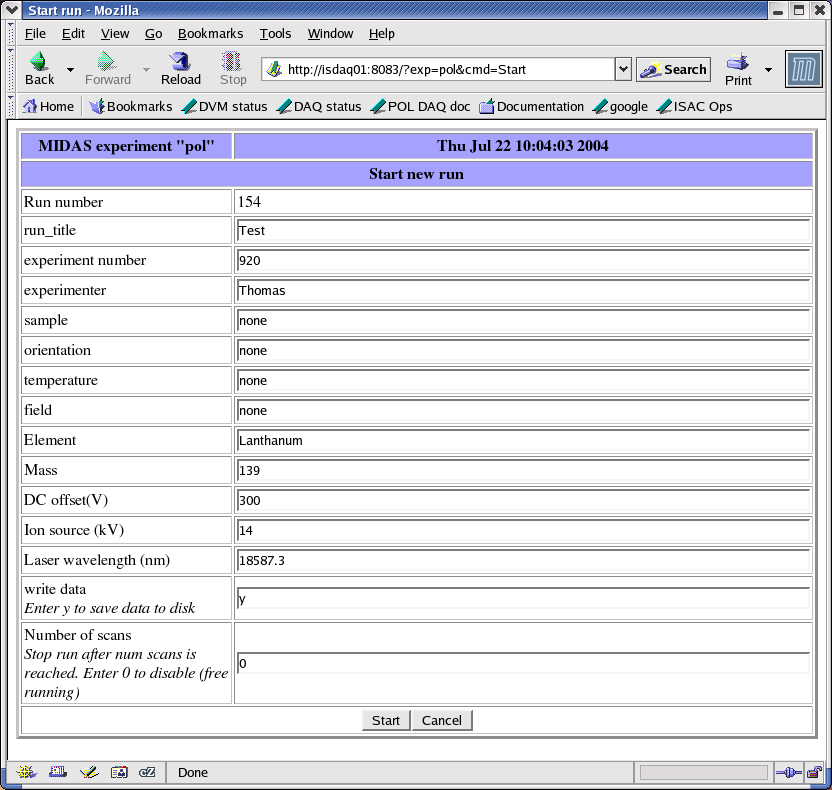
- Press Start to start the run. You will get a new window to enter the variables for this run.
- Press Start again. After a few seconds, you should see the cycling variable being set in the PPC window. You can examine the histograms from the other desktop. (see below)
- Press Stop to end the run
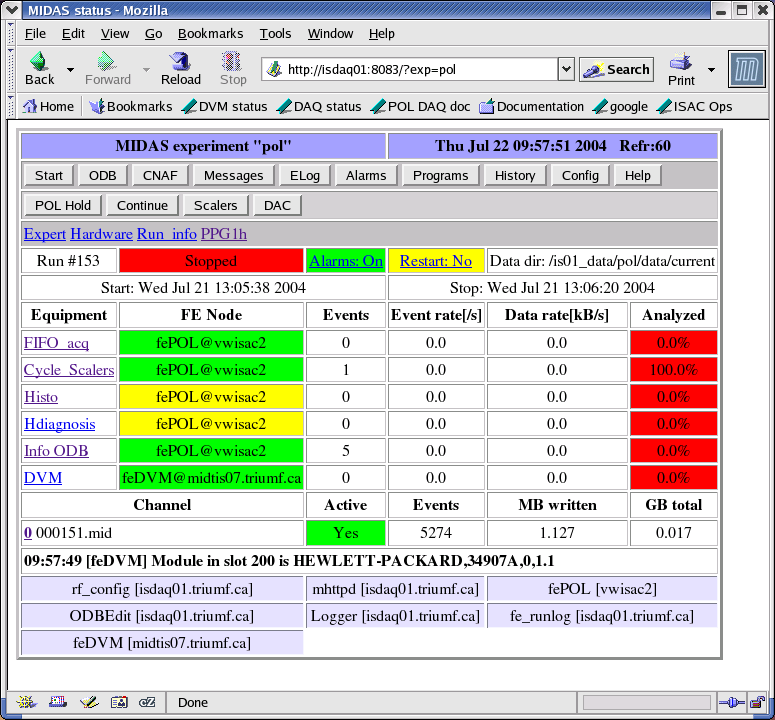
Note: to clear the Alarms, click on Alarm button then on Reset. The Alarms do not clear automatically even when the alarm condition is fixed.
Note: if the run does not start, one of your parameters might be off range. Go twice backwards by pressing the Back bouton on your browser and check the last message. You can check all the messages by pressing on the Messages bouton from the status page.
In DESKTOP 2


Frequently Asked Questions
Before an experiment
The 'DAQ status' bookmark does not work in my browser. What happenned ?
First you should verify, if not logged on the isdaq01 machine, that you are using a browser issued form isdaq01 (by typing netscape & in the appropriate Xterm).
If this is not the reason, then you might have killed the deamon that ensures the existence of the page. This is reinitialized during a start-all process or can be set on itself by typing start_mhttpd in the isdaq01 Xterm.
Despite all the instructions
above on the start-all process about the Performance 4000 terminal server,
the PPC is still inaccessible. What shall I do ?
In such a case one can always use the front end to reboot by pressing on either 'ABT' or 'RST'. Note that if you start-all after that, the PPC window now displays the rebooting sequence.
There are many parameters that
one can set in the ppg1c section but the meaning of everyone
of them is not really clear to me. Is there any place where I can find
information on those ?
Of course, if the comment next to each of them is not clear enough, a more detailed explanation is available in the BetaNMR documentation. One can access it via the DAQ bookmark on your browser, then clicking on Online > BetaNMR documentation [top right] > 1c [first table - last line] in order to see the details on each of those parameters.
Take this chance to browse through the bookmarks displayed in the isdaq01 Netscape as they are all related closely to our experiment.
Some of the 'FE Node'
are yellow instead of being green. Is it still OK for me to perform my
run ?
The elements shown in yellow are the ones which for the code is available but not enabled for our particular experiment. The associated functions are used by other groups in their systems but we don't want to have them in here, at the same time we want to assess their existence. Those are not to worry about in any case.
What are all the boxes at the
bottom of the status window about ?
The boxes at the bottom of the status window display the name of the functions/programs that run in the background, together with the computer they work on.
During an experiment
My page had turn blank while I tried to start the run. What is wrong ?
As mentioned in this documentation, simply go back twice in your browser and check for an error message in the Messages section. The most probable thing is a variable being out of range.
The first run went fine but
then the PPC keeps on sending weird error messages saying that the CAMP
is disconnected. What is wrong ?
Some values for the increment of the DAC like 0.1V are improperly rounded by the system. As it tries to get as close as possible to our need, the final voltage might be slightly out of range for the DAC. The result is that the CAMP device gets disconnected from the acquisition system. The solution is to stop the run and reduce the final voltage. As we might not be interested in the very last point, putting 9.99V for final voltage instead of 10V doesn't seem a big problem.
The software does not seem to
recognize my increment. Actually it only jumps every two or three cycles.
Is there any problem ?
The DAC is only a 12 bit apparatus. As it goes from -10V to +10V, the 4096 steps are to be spread in a 20V range. The consequence is that the smallest possible DAC step is of the order of 0.005V. Any attempt of forcing a smaller increment will result in stepping only when the increments sum up to 0.005V.
The histograms are really nice
but what I would like to see is the exact reading. Where can I find this
in the system ?
You can see the readings in the fluorescence monitor any time by clicking on the Cycle_Scalers link in the status page of the browser. To see any new reading, you need to refresh the browser, either by going back to Status and clicking on Cycle_Scalers again or by clicking the Reload button on the browser.

Note that there are additional information in the Info ODB section, that can be accessed just as Cycle_Scalers.
After an experiment
Where are the data stored ?
The directory in which the data are stored is written in the top right corner of the Status browser. The default one is /home/pol/dlog/current.
What are the different files
?
For every run, no matter how many scans are performed, three files are created:How can I look at the files ?***.odb contains the exact same information as one can see in the ODB at the end of a run. It includes, but is not limited to, the time of beginning and end of the run, the number of scans and steps and some messages ***.mid contains all the data as numbers, the readings of all the scalers as well as the DAC readback and the DVM readback. ***.rz contains the histograms in a PAW format. ***.txt contains columns of data with the cycle number, the scan number, the DVM read back and the fluorescence monitor count.
***.odb is an ASCII file and can be seen with the more command in a Linux shell or with any other ASCII viewer/editor. ***.mid is not an ASCII file !! If you want to take a particular look at it, the command you have to type in a Linux shell, on isdaq01 and in the proper directory, is mdump -x -f d -i 3 ***.midThis will let you look at the file with the values in decimal and rid of the unecessary elements. For more information on the use of the mdump command type mdump -x -h in any Linux shell.***.rz is a PAW histogram file. To acces it, just use PAW as for the online reading, but instead of setting the global_sect ONLN you just need to open the file. ***.txt is an ASCII file that can be treated with any text editor or with Origin, Excel, ...
How can I analyse the data ?
This program only does the acquisition. The analysis is left to the group to perform. One can set a program to work on the .mid file or one can use PAW to fit the data or one can use the .txt ASCII files.
If I know one scan was bad but
I don't want to loose all the others from the same run, what can I do ?
Since all the single events are still contained in the .mid and .txt files, one can always reperform the sum of the arrays in order to get what is really interesting from the run.
How can I access the Elog from
outside TRIUMF ?
One can access the Elog from outside TRIUMF either through the MIDAS control page http://isdaq01.triumf.ca:8083/?exp=pol or if you want the page directly, at the address http://isdaq01.triumf.ca:8083/EL/?exp=pol.
This require a password as we do not want any one to access it by mistake. The password is the same as the one for the account. Once entered the computer remembers it in a cookie for 24 hours. Note that any one can still look at the readings from that point of view without interferring with the acquisition.
Contacts
At TRIUMF
Renee PoutissouAt McGill
#7457
renee@triumf.caSuzannah Daviel
#7306
suz@triumf.caDonald Arseneau
#6295
asnd@triumf.ca
Thomas Cocolios
cocolios@hep.physics.mcgill.ca
