Running the POL DAQ system at TRIUMF
by
admin
—
last modified
Oct 23, 2007 04:22 PM
How to run the POL DAQ system at TRIUMF
This page is meant to guide the users of the Collinear Laser Spectroscopy beam line through the basics of the acquisition system
Last updated on July 22nd, 2004.
Running the Pol DAQ system
Initialization
- Sign on to machine isdaq01 as user pol
- In a terminal window type --- start-all --- in order for all the components of the program to start.
- The Runlog client runs in the green window labelled "Pol
runlog". It writes to the runlog file, and checks that all relevent
clients have started successfully; otherwise it stops the run.
- The PPC window (beige, labelled "PPC BNQR/POL" displays the output from the frontend client, including the evolution of the variables for the scan.
- The analyzer creates the histograms and the ASCII file from the data.
- The feDVM client's output is to a file ~/pol/slow/dvm/feDVM.log. This lets us know of the interaction of the system with the DVM that is used to set the DAC and read back the voltage and the beam current.
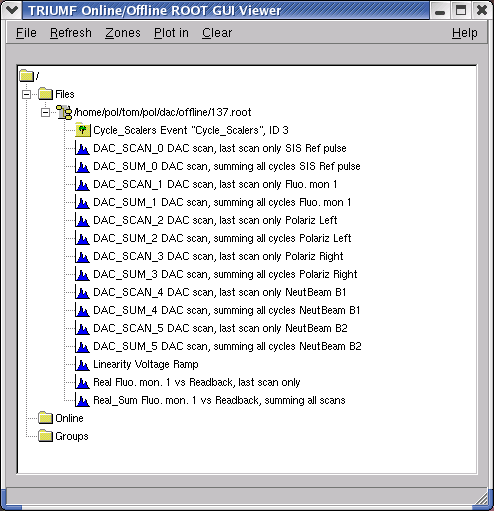
- The TGUI is an interactive interface for looking at the ROOT histograms created online by the analyzer.
- In the beige PPC window, type carriage return to get the prompt -> , then type --- reboot ---
- Start a web browser (e.g mozilla or seamonkey) by clicking on the icon, then click on DAQ status
If you do not know the password or if you have lost it, contact Suzannah Daviel or Renee Poutissou to retrieve it.
If you are logged from another machine such as Midtis04 by the laser hut, make sure to connect to isdaq01 by typing in the terminal --- ssh pol@isdaq01 ---.
start-all starts all the clients needed for the experiment... different windows should appear, one each for the Runlog (green), PPC (beige) , analyzer (blue), and TGUI.
It also starts he DVM client as a daemon, writing its output into a log file.
This reboots the PPC and starts the frontend client. There will be a lot of output. When the PPC is ready, you see the message:End of routine frontend_init. PPC is READY
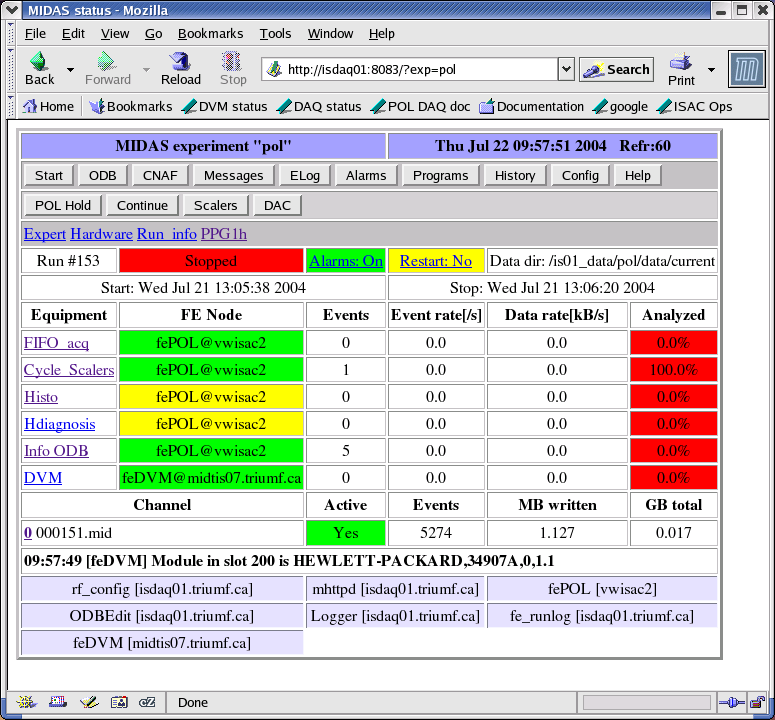
This is the main command center of the acquisition system, the place from which any parameter can be accessed and changed and that enables users to start a run.
It can be reaccessed any time by simply pressing DAQ Status in the favorite tool bar or by pressing the Status button at the top of the page.
The following picture shows the status page as it should be when all tasks are running. After start-all, you may see alarm banners which say e.g.
"Caution: fepol is not running". Since the alarm banners do not disappear automatically when the clients are started, you must reset the alarms yourself by clicking on
"Alarms" then on "Reset all Alarms", then on "Status" to return to the main status page.
Setting the parameters
- Select Scaler or DAC by clicking on the appropriate button.
- Scaler is a mode that runs continuously and just acquires counts from the photomultiplier without scanning any device. This is useful is someone wants to scan the laser frequency.
- DAC is a mode that scans the DAC according to preselected parameters. This is the mode that we are likely to use if we want to scan the retardation potential.
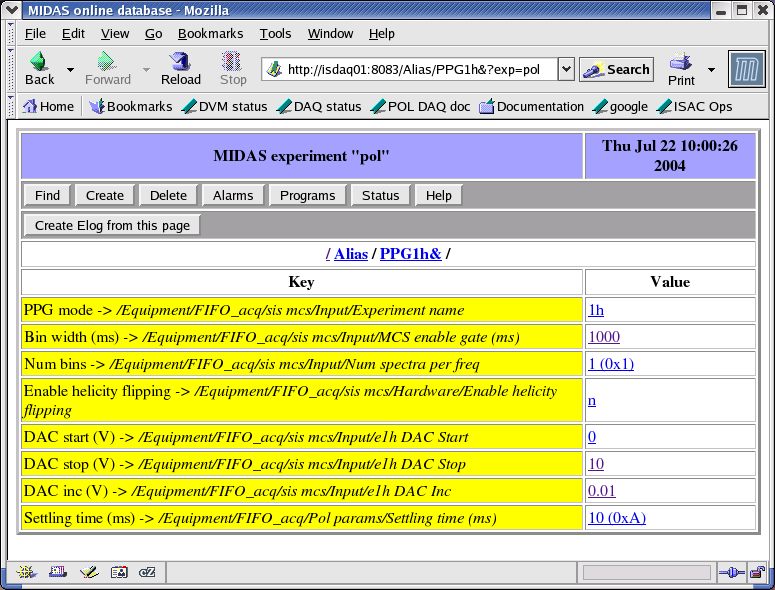
- Select PPG label below
the buttons to setup the parameters by clicking on the link (PPG1h or
PPG10)
Selecting Scaler causes a link PPG10 to appear below; selecting DAC causes the link PPG1h to appear after a short time.
Note that you have to hit Reload in your browser after clicking Scaler or DAC in order to display the updated link (PPG10 or PPG1h) on the page in a timely fashion.
The names are different for each mode because the parameters are different. Make sure the parameters are correct before any run.
- Press Status when all parameters are set to get back to the main page.
Running
- Press Start button to start the run. You will get a new window to enter the variables specific for this run.
Those variables are to be entered for recording with the data file as a copy of the information stored in the log book. Those values are not used in any computation but only for recording. These values are also stored in the runlog file (runlog.txt) in the data area.
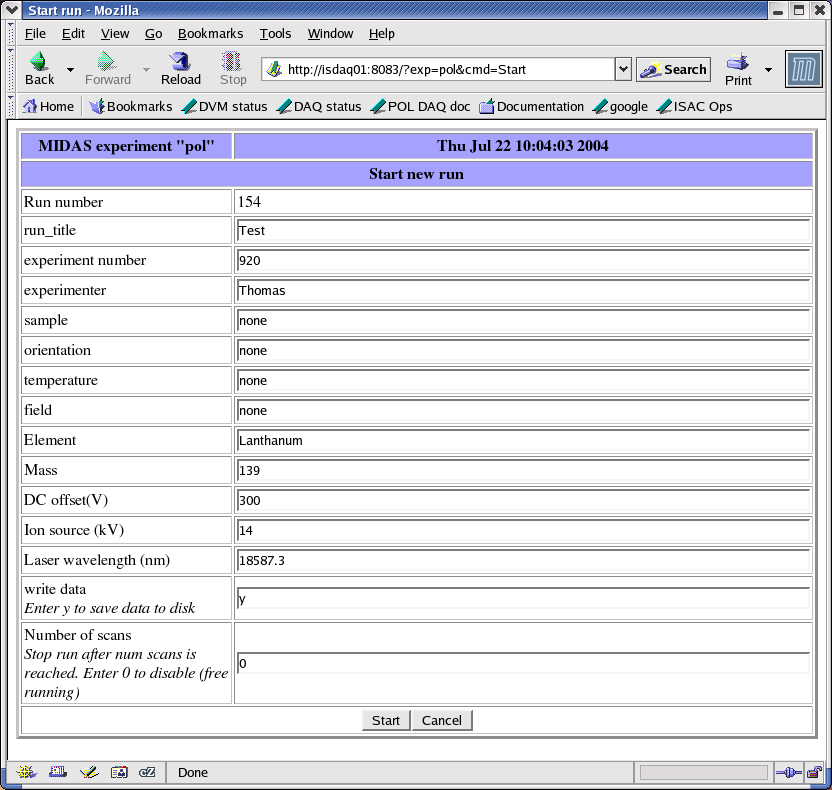
- Press Start .
- In the TGUI click on File and then in the menu in Online. In the box that appeared, type --- isdaq01:9090 ---.
- Press Stop to end the run
After a few seconds, you should see the cycling variable being set in the PPC window.
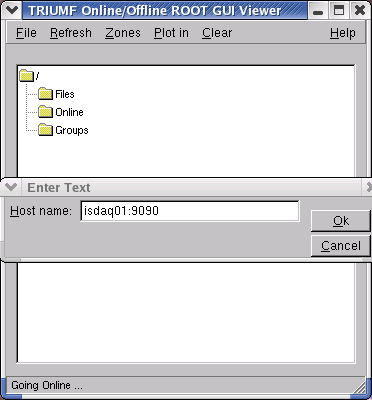
This will open an extra window where all the histograms being created are listed. Double-clicking on any of them will display the histogram at its current status.
Note that the refresh is by default set to Off by TRIUMF and that you have to change it yourself.
Discarding Bad data by using Thresholds and the Bad Scan buttons
It is possible to set up a thresholds whereby the data for a particular cycle is not sent out if the sum of the data in that cycle falls outside a preset threshold, i.e the data for that cycle is discarded, and the cycle is repeated. Only when the data statisfies all enabled threshold conditions is it accepted. This means that if something happens to the experiment (e.g. the beam goes off) the data will be discarded, and bad data will not be added to the histograms.To set a threshold
For the POL experiment, three thresholds are provided, set on the P+ beam, the Laser Power and the Faraday Cup 15, signals which are all connected to the multi channel scaler. At the beginning of the run, a scaler data for those three signals are summed over a cycle, and is kept as three reference values.The desired threshold values are set as a percentage of the reference, by clicking on "Hardware" on the status page.
| /Alias/Hardware |
|
| Key |
Value |
| P+ threshold -> /Equipment/FIFO_acq/sis mcs/Hardware/Cycle thr1 (%) | 30 |
| Laser threshold -> /Equipment/FIFO_acq/sis mcs/Hardware/Cycle thr2 (%) | 0 |
| Fcup threshold -> /Equipment/FIFO_acq/sis mcs/Hardware/Cycle thr3 (%) | 0 |
| repeat scan -> /Equipment/FIFO_acq/sis mcs/Hardware/out-of-tol repeat scan | n |
| skip ncycles after out-of-tol -> /Equipment/FIFO_acq/sis mcs/Hardware/skip ncycles out-of-tol | 3 |
| disable Epics bias read -> /Equipment/FIFO_acq/sis mcs/Hardware/disable Epics checks | n |
To disable a threshold
A value of 0% disables the thresholds, so all cycles are accepted and sent out without being checked.How the thresholds work
If a threshold is set non-zero (for example, say the Laser Power is set to 30%) the sum of the scaler data for Laser Power is compared to the reference value for Laser Power. If the absolute value of the counts for this cycle are within 30% of the reference value, the cycle is accepted and sent out. Otherwise it is rejected, and the cycle is repeated (at the same scan value). Only when a cycle is accepted is the scan value increased and the next cycle begins. If more than one threshold is set non-zero, the cycle will not be sent out until the cycle passes all enabled (non-zero) thresholds.Skip cycles after a bad cycle
Often it's desirable to allow the hardware to stabilize after a bad cycle - for example if the beam goes off, it may take things a few seconds to settle down before the data is good again. In this case, setting the parameter "skip ncycles after out-of-tol" (also accessed by clicking "hardware" on the main page) to say 3, will skip 3 good cycles before allowing data from the next good cycle to be sent out.Re-referencing
Sometimes the reference value needs to be reset to a new value - this is done by pressing the buttons "Reref all" or "Reref P+" or "Reref Lsr" or "Reref Fcup" on the main status page. The next cycle is used to recalculate the reference value(s).Bad Scan flag
It is also possible for the user to label a whole scan as bad by pressing the "Bad Scan" button during a scan so that the analyzer will discard the whole scan.TRIUMF Contacts
| Renee Poutissou + | Suzannah Daviel + |
David Morris * |
| #7457 | #7306 | #6295 |
| renee@triumf.ca | suz@triumf.ca | cadfael@triumf.ca |
KEY
+ general DAQ problems
* GPIB hardware problems only
+ general DAQ problems
* GPIB hardware problems only
[Home] [Collinear Laser Spectroscopy Guide][Pol DAQ Instructions] [Pol DAQ FAQ] [Using EPICS]
Data Bank Contents
HSCL Scaler Bank Contents for POL: |
Scaler Input |
|
| bank sent every 100ms and at end-of-run |
||
| Word 1 |
SIS Ref Pulse |
1 |
| Word 2 |
Fluorescence Monitor |
15 |
| Word 3 |
P+ beam |
16 |
| Word 4 |
Laser Power |
17 |
| Word 5 |
Faraday Cup 15 |
18 |
| Word 6 |
Locking Feedback |
19 |
CYCI Bank Contents for POL: |
||||
| bank sent every cycle |
||||
| Word 1 |
cycle |
|||
| Word 2 |
supercycle counter | |||
| Word 3 |
scan number | |||
| Word 4 | Dummy value (helicity) | |||
| POL DAC SCAN |
POL EPICS SCAN (Phil's expt) |
|||
| Word 5 |
8 = POL DAC scan |
1= NaCell 2= Laser |
||
| Word 6 |
not used (previously wavemeter)
|
Epics Value Read | ||
| Word 7 |
not used (previously
DVM[2] Locking feedback) |
Epics Value Written | ||
| Word 8 |
DAC Set value | 0 |
||
| Word 9 |
DVM[0] DAC readback value
( -1 for error ) |
0 (previously DVM[2] Locking feedback) | ||
MONI Bank Contents for POL |
|
| end-of-scan and at begin-of-run | |
| Word 1 |
Bad scan flag (user settable,
1=bad scan 0=good scan) |
| Word 2 |
Epics Bias (= -99 if
error or Epics is disabled) |
| Word 3 |
Wavemeter (= -99 if error) |
DAQ Notes
DAQ Hardware/Software components
The POL experiment uses the same DAQ hardware as the BNQR experiment,
i.e. SIS Scaler, Power-PC, PPG all in VME. For information on
these modules, see the BNMR/BNQR
DAQ Document (Hardware Components). The SIS VME Scaler has enough inputs that it can support BNQR scalers inputs and POL inputs at the same time. The Scaler inputs used for the POL experiment are listed in the HSCL bank below. The PPG will be loaded with the appropriate code for the experiment automatically. However, the PPC has to be manually switched when the experiment is changed between BNQR and POL.
The PPC (frontend) software and some of the components (e.g. rf_config) are basically a simplified version of that of BNQR/BNMR. The BNMR/BNQR DAQ Document contails extensive information about these components.
Check PPC is
booted for POL experiment (not BNQR)
NB The Power-PC (PPC) must be booted
as POL to
run the POL experiment. The PPC and other DAQ Hardware is shared with the BNQR experiment.
If the BNQR experiment has been running last, the PPC may boot the BNQR software when rebooted. It will give the message on the PPC consol :
"BNQR
frontend code is starting" rather than
"POL frontend code is starting".
"POL frontend code is starting".
Another way of telling is (on isdaq01) to check the softlink startup.cmd , i.e. type
[pol@isdaq01 pol] ls -l /vw-ppc/config/vwisac2/startup.cmd
This will give either
lrwxrwxrwx 1 midas users 7 Oct 17 09:18 /vw-ppc/config/vwisac2/startup.cmd ->pol.cmd
or
lrwxrwxrwx 1 midas users 7 Oct 17 09:18 /vw-ppc/config/vwisac2/startup.cmd ->bnqr.cmd
If the frontend is not booted to run POL, the frontend will not run.
To change PPC
bootfile to boot POL experiment
To change the PPC between POL and BNQR experiments, contact a DAQ expert.The procedure is:
log on to isdaq01 as "midas"
cd /vw-ppc/config/vwisac2
source link_pol (or source link_bnqr)
This file will change the softlink named "startup.cmd"
Backup of data directory
When POL is actually running, the lazylogger is set up to archive the
data files (*.mid). It will stay three runs behind the current
run number.The lazy logger will copy only the data files (the *.mid) to an archive directory which will be on a data disk on isdaq02,
path is /isdaq/data21/pol/data/current/
| MIDAS experiment "pol" | Thu Feb 24 13:11:50 2005 |
|---|---|
| / Lazy / Disk / Settings / | |
| Key | Value |
| Maintain free space(%) | 0
(0x0) |
| Stay behind | -3
(0xFFFFFFFD) |
| Alarm Class | (empty) |
| Running condition | ALWAYS |
| Data dir | /is01_data1/pol/data/current |
| Data format | MIDAS |
| Filename format | run%05d.mid |
| Backup type | Tape |
| Execute after rewind | (empty) |
| Path | /isdaq/data21/pol/data/current |
| Capacity (Bytes) | 5e+09 |
| List label | (empty) |
| Execute before writing file | (empty) |
| Execute after writing file | (empty) |
| Modulo.Position | (empty) |
| Tape Data Append | y |
Also a cron job has been set up to make a copy of the current data directory every hour. Again, this job must only be done during
the beam period. If something happens to the data directory (i.e. someone inadvertantly deletes all the current data) the cron
job must be stopped at once or the copy of the data will also be overwritten when the cron job next runs. Alternatively,
the archived copy must be quickly renamed or copied elsewhere.
When the cron job is enabled, the designated user (Thomas) will receive a mail message similar to the following one
every so often:
Date:
Fri, 3 Dec 2004 14:00:01 -0800
From: pol reminder <donotreply@triumf.ca>
Subject: your data files are still being backed up every hour
The cronjob to backup your data files is running every hour.
This should only be done during your beam period.
If you have finished running, log onto isdaq01 as pol:
[pol@isdaq01 pol] crontab ~/online/cron/pol_nocron
To restart the backup, execute
[pol@isdaq01 pol] crontab ~/online/cron/pol_cron
Virtually yours,
Suzannah
This explains how to enable and disable the cron job before and after your run.
To Build the code
On isdaq01 as pol,cd ~/online/pol
Note: if new parameters have been added to certain areas of the odb (e.g. /equipment/fifo_acq tree) a new experim.h must
be generated in this directory (~pol/online/pol) prior to building the frontend code.
odb
[local:pol:S]/> make
[local:pol:S]/> exit
This generates a new experim.h
make clean
make
This builds the frontend fepol, also fe_runlog.
Rebuild rf_config :
cd ~/online/rf_config
make clean
make
Then rebuild feDVM, which runs on midtis07
ssh pol@midtis07
cd slow/dvm
make
Note that pol's account on midtis07 uses the same disk as pol on isdaq01. So to rebuild feDVM, must use the experim.h
from /home/pol/online/pol. The Makefile has been changed to delete any experim.h in the local account, and use the
one in the correct place. But if building feDVM to use a local experiment (not "pol"), it would be necessary to save a new experim.h
in the local directory before make (and not do make clean).
Sources
The PPC frontend program (fepol) uses (or should use) the same source as bnmr/bnqr experiment (febnmr.c). "ifdef" statements are used around parts specific to each experiment. Therefore the ~pol/online/pol directory on isdaq01 is the same as ~bnmr/online/bnmr in cvs. Hence for pol-specific sources, a directory ~pol/online/cvspol has been defined.The same is true of the rf_config directory ~pol/online/rf_config.
feDVM uses the sources feDVM.c Agilent34970A.c dd_gpib.c and includes Agilent34970A.h dd_gpib.h.
Copies of these files are now stored in cvs (~pol/online/cvspol/slowdvm) on isdaq01.
Problems
PPC (frontend) program fepol will not run
- If PPC has not been rebooted, then reboot by typing "reboot" on
PPC consol.
- If PPC has been rebooted, check that it is booting the correct code (POL not BNQR). If not, get it changed over.
- If it still does not run, consult an expert.
Disappearing gpib driver
After kernel upgrade or replacement of machine midtis07, the gpib driver may disappear.
Then you see the message "Cannot open GPIB address 8"
[local:pol:S]/>scl
Name Host
fePOL vwisac2
Logger isdaq01.triumf.ca
Lazy_Disk isdaq01.triumf.ca
rf_config isdaq01.triumf.ca
ODBEdit isdaq01.triumf.ca
[local:pol:S]/>cleanup
13:58:28 [feDVM] Program feDVM on host midtis07 started
13:58:34 [feDVM] [dd_gpib.c:144:gpib_init] Cannot open GPIB address 8
13:58:34 [feDVM] [dd_gpib.c:292:gpib device driver] GPIB ibwrt addr 8 cmd SYST:CTYP? 100 error code 0x8100
13:58:34 [feDVM] [dd_gpib.c:347:gpib device driver] GPIB ibrd addr 8 cmd error code 0x8100
13:58:34 [feDVM] Module in slot 100 is
13:58:34 [feDVM] [Agilent34970A.c:485:Agilent34970A_config] Mismatch for ODB module type and hardware
13:58:34 [feDVM] [dd_gpib.c:292:gpib device driver] GPIB ibwrt addr 8 cmd *ESE 1; error code 0x8100
13:58:34 [feDVM] [dd_gpib.c:292:gpib device driver] GPIB ibwrt addr 8 cmd ROUT:SCAN (@101,102,103,104); error code 0x8100
13:58:34 [feDVM] [dd_gpib.c:226:gpib device driver] GPIB ibrsp addr 8 error code 0x8100
13:58:34 [feDVM] [dd_gpib.c:292:gpib device driver] GPIB ibwrt addr 8 cmd *ESR? error code 0x8100
13:58:34 [feDVM] [dd_gpib.c:292:gpib device driver] GPIB ibwrt addr 8 cmd READ?;*OPC; error code 0x8100
13:58:51 [feDVM] client [midtis07.triumf.ca]feDVM failed watchdog test after 10 sec
13:58:51 [feDVM] Program feDVM on host isdaq01 stopped
Fix: gpib driver must be re-installed:
See installing the gpib driverDisappearing gpib devices /dev/gpib0
Occasionally the devices seem to disappear for no apparent reason, but the gpib driver is still installed. Following the instructions in installing the gpib driver starting with make install will re-install the devices.Constant restarts of fedvm; fedvm not running
Sometimes the fedvm client has crashed, but the process is left running on midtis07. The mhttpd alarm system keeps trying to restart it but it fails because the old process is still running.Fix: kill the defunct feDVM process on midtis07
Log onto midtis07ssh pol@midtis07
cd dvm/slow
start_feDVM
start_feDVM: feDVM is already running
psu feDVM
pol 19481 0.9 1.3 7204 5160 ? S 11:07 0:03 ./feDVM -h isdaq01 -e pol -O
pol 19518 0.0 0.1 3580 640 pts/0 S 11:14 0:00 grep feDVM
kill -9 19481 (NOTE: use the process ID for the feDVM task from the psu command above)
start_feDVM
Program feDVM restarted
No handshake from the DVM
Check that feDVM is running on midtis07 and that the DVM is switched on. Sometimes it's necessary to cycle the power on the DVM if it is in a strange state.Make sure that feDVM has been built with Agilent34970A.c (not cd_Agilent34970A.c) which does not support the dvm handshake.
